This discussion has been locked.
You can no longer post new replies to this discussion. If you have a question you can start a new discussion

Foglight Alerts and associated devices

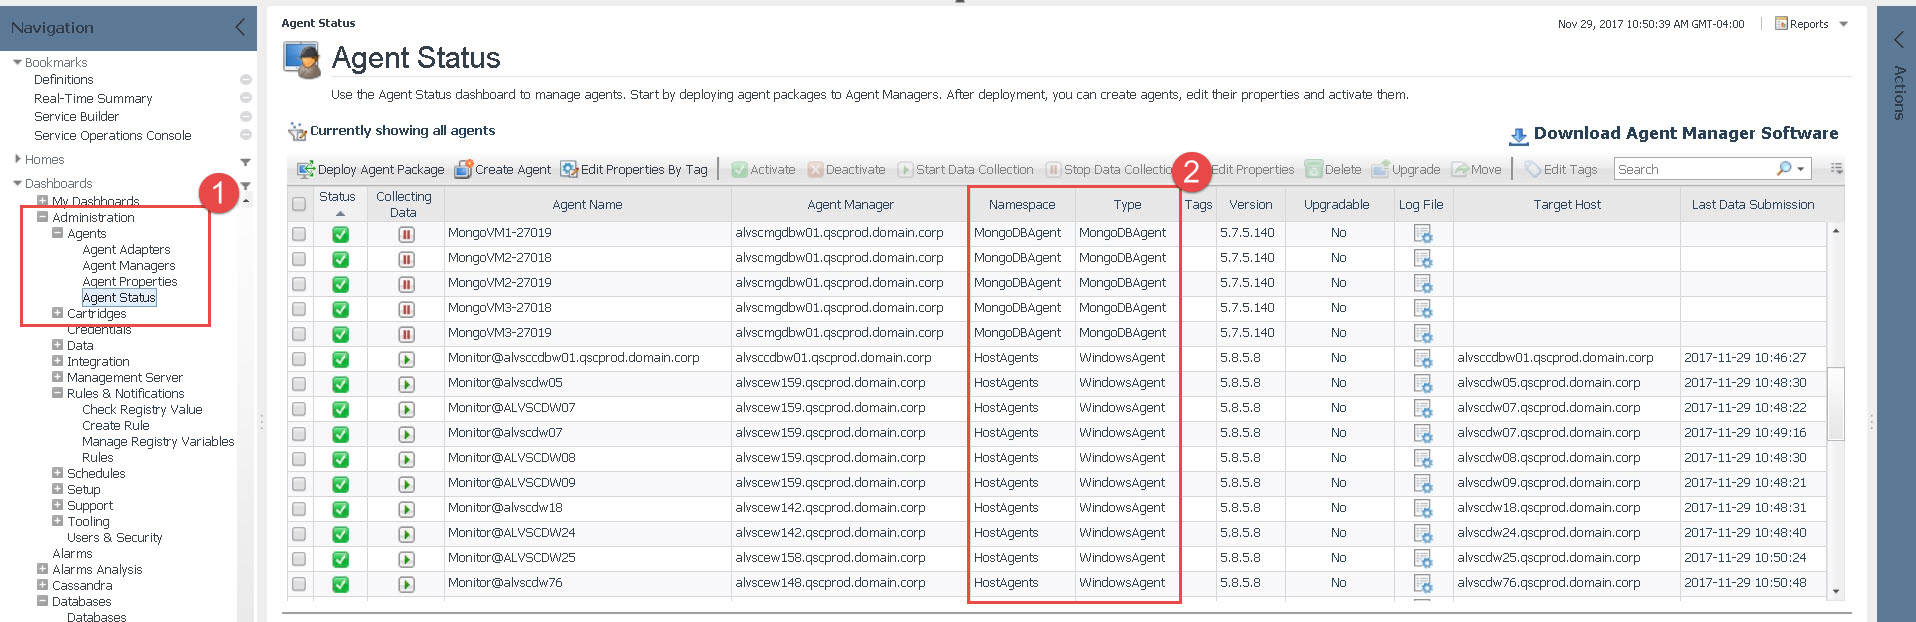
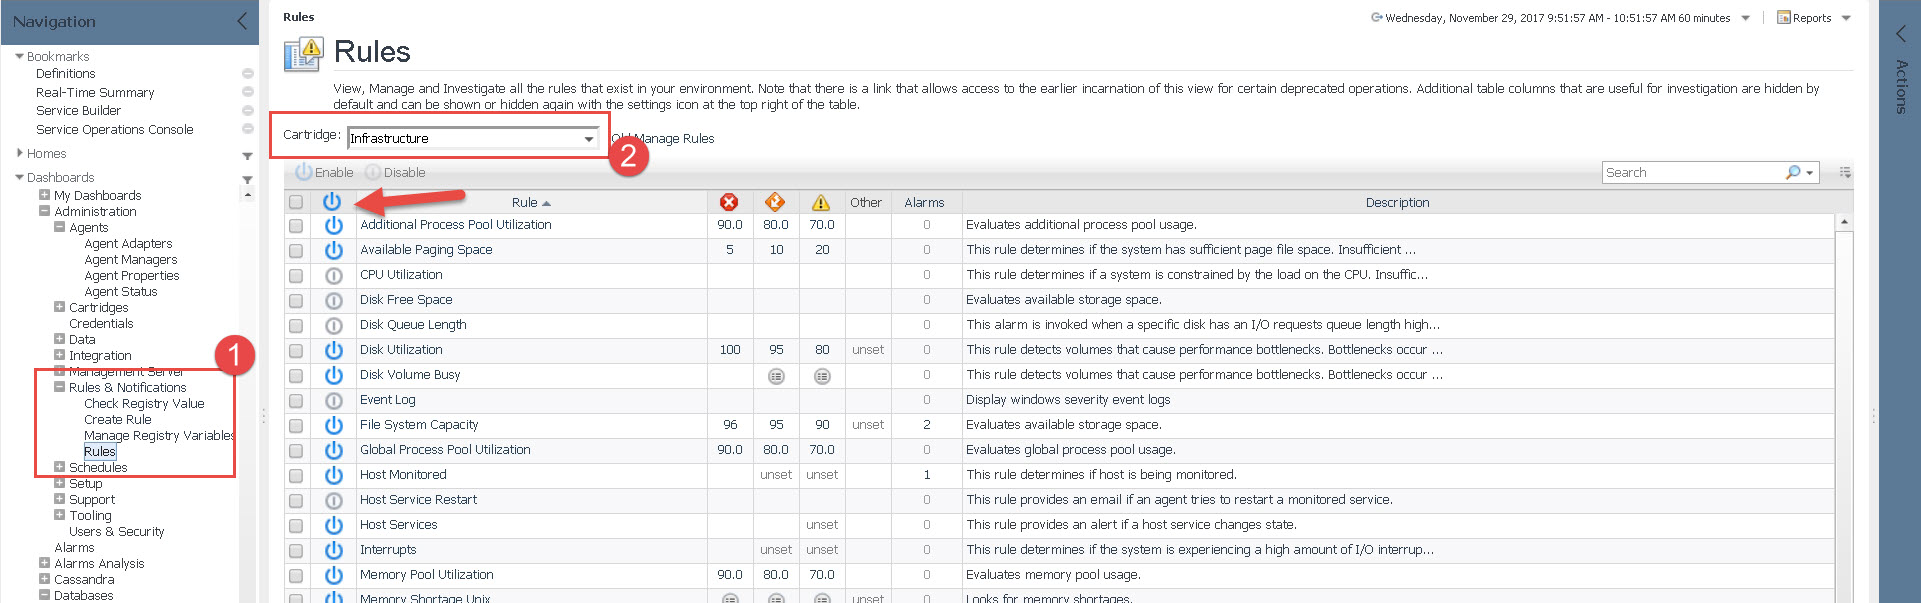
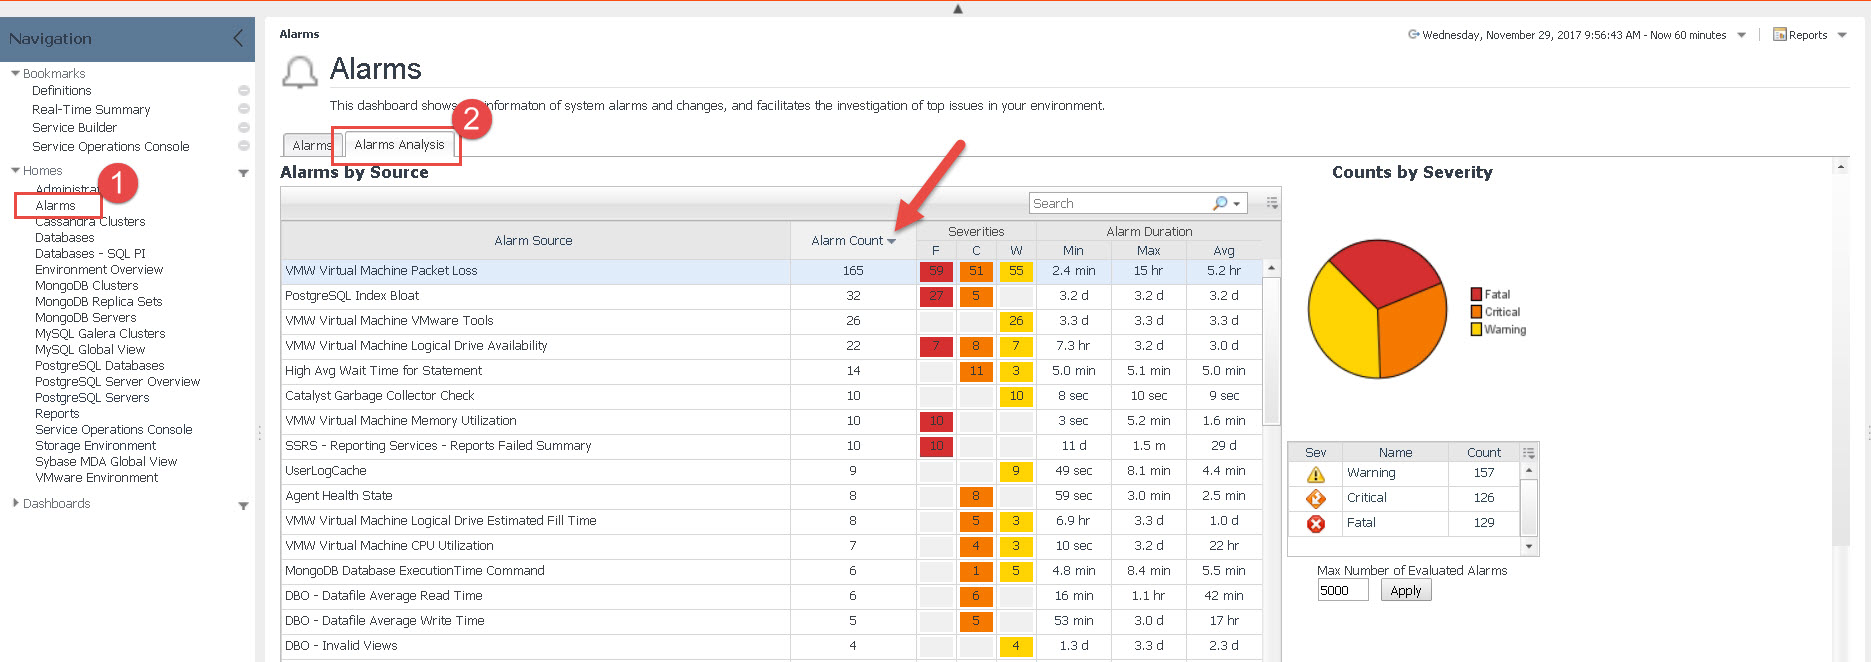
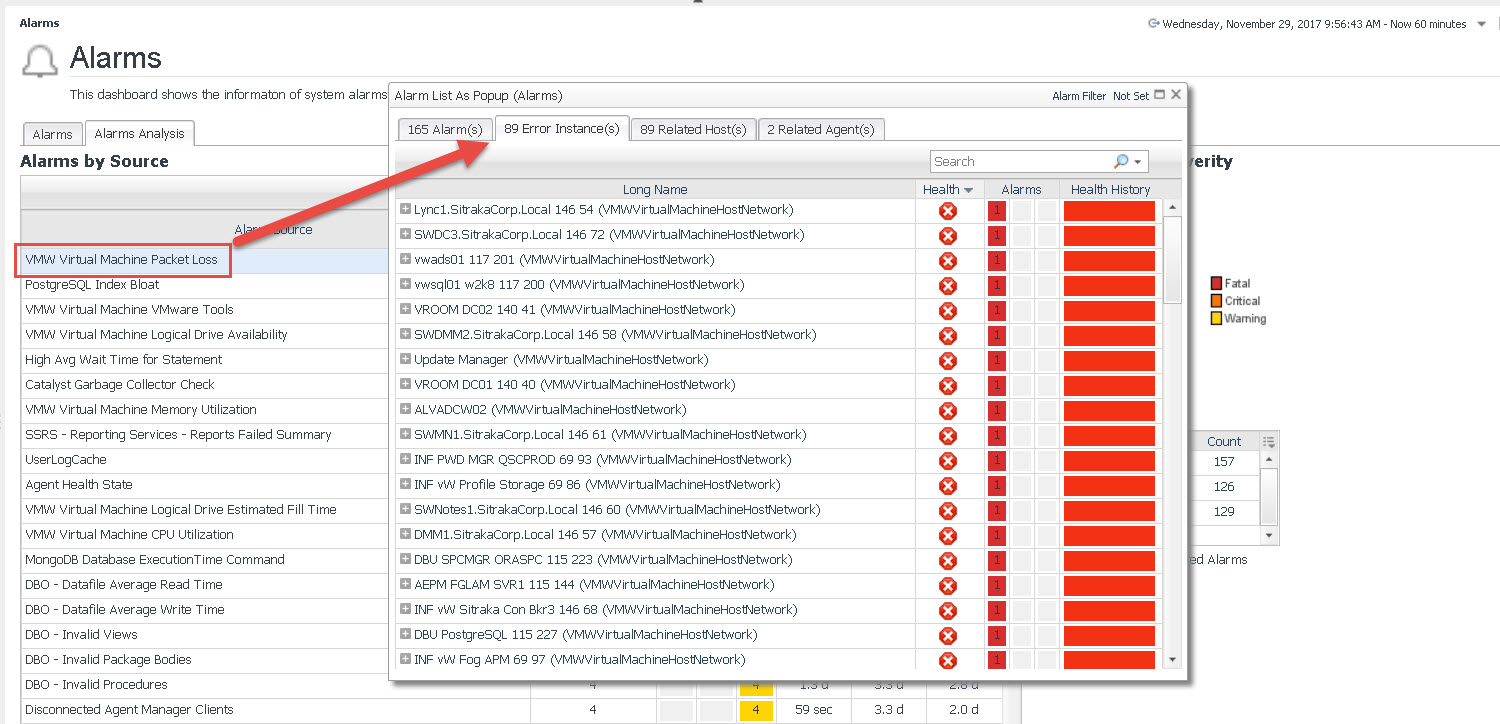
Can Foglight create a reports  to show the monitored devices and there associated alerts. I'm not an administrator to verify all true, but being told this isn't possible? An 200 page report can be generated of all alerts but nothing can be created simply to list the devices monitored and there associated alert.

  • Hallo Eric,

    if the data is being collected and displayed on a dashboard, you can create a report for it. I would say you can create a report on nearly all metrics Foglight can collect.

    There are several out-of-the-box reports. You can find on the Reports dashboard under "Run a report". If there is no report matching your requirement, you can create your own report under "Build a Custom Report".

    Building your own report can become complex if you start to create your own queries.

    I would recomment to involve our PSO team as they have a lot field experience and creating custom dashboard and reports is their daily business. You can tell them which report you need and how it should look like and they can create it for you. To get in contact with them you can either speak with your sales account manager or you contact them via our webpage.

    As a starting point for you, I like to recommend the Foglight User Guide. More information and examples for custom dashboards or reports you will find in the Web Component Guide and the Web Component Tutorial.

    If you provide more details here (what exactly you need), our technical consultants can provide more tips and tricks in this thread.


    Kind Regards

    Nicola


  • Nicola
    Thank you for your quick response. As I believed the Foglight application should be able to provide a report of its status etc.. The root of the situation is we have alerting setup on multiple devices and I want to see exactly which devices have what monitoring rules assigned. I'm being told this is an extensive process to create a report to show me that information. I will continue to research and read the user guides etc.. Thank you again
  • Hi Eric,

    The first step to see what rules apply to a "device" is to check the Agents Status page to see what type of device it is. The namespace and type columns will help. Most agents are fairly easy to figure out.

    Then we go to the Rules dashboard, and pick the cartridge type from the pulldown. Normally it's easy to see a 1:1 relationship from the prior dashboard, but I picked one where it's not. HostAgents generally fall under the Infrastructure cartridge. From there, we can see what rules are enabled for that type.


    A rule fires when a condition is met. The result is an alarm (or some will say an alert). There is a 1:n relation between a rule and alarms. For example, if we have 100 hosts being monitored, and they all have a condition where the "cpu utilization" rule evaluates to true, then we would have 100 cpu utilization alarms.

    The quick way that I take to see "what has fired" is to use the Alarms Analysis dashboard. Navigate to the Alarms dashboard, then Alarms Analysis tab. Pick a time range and then sort by Alarm Count.

    Clicking on an alarm in the Alarm Source column pops up additional detail. Select the "Error Instances" tab to see the objects (ie. devices, hosts, etc.) that the rule fired an alarm against.

    Hope that helps a bit.