The Foglight Difference – Advanced Database Performance
 08:27
08:27
Related videos
Cloud Database Native Monitoring - What You Don't Get
Cloud Database Native Monitoring - What You Don't Get
Duration: 18:48
Developers Using Operations Class Tools for Testing Performance
In this short video, we highlight the benefit of developers using Foglight to test the performance of a query before it hits production. We crossed over into a conversation on the fundamentals of DevOps - it requires cultural change, process, and people need to change. What’s the stimulus to get that change and collaboration?
Duration: 23:23
Foglight vs. Enterprise-Wide Monitoring
Foglight goes beyond enterprise-wide monitoring with its breadth of coverage and granular reporting of workload and performance. Gain a deeper understanding of what’s happening across your entire enterprise with one centralized solution.
Duration: 04:52
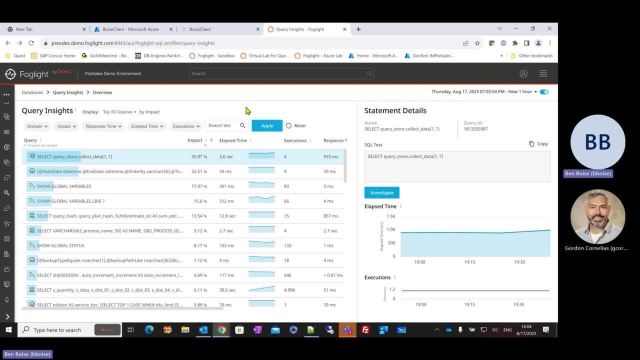
Foglight Query Insights with Easy Buttons
Write quality code with your existing resources with the new feature released in Foglight 6.3 that makes it easy to locate queries ripe for optimization and generate distinct execution plans.
Duration: 06:23
Foglight vs. Cloud Monitoring
With native monitoring by cloud vendors, the types of metrics available are minimal and require additional expenses or resources to build out. With Foglight, you get advanced visibility with a rich history of workloads and instances right away.
Duration: 06:09
Foglight vs. Third Party Database Monitoring
Foglight empowers DBAs across your organization to deep dive into platforms both that they’re familiar with, as well as those they’re not so familiar with. With its web console and customizable dashboard, DBAs for SQL Server, Oracle and others can easily digest information important to them.
Duration: 04:43
How TransUnion uses Foglight to monitor their databases
Anthony Stephens of TransUnion explains how they use Foglight and Foglight Performance Investigator to diagnose and resolve database performance issues.
Duration: 01:47
TransUnion improves database performance monitoring with Foglight
TransUnion shares how Foglight helps to maintain high levels of uptime and performance for their applications that manage 1 billion consumer files.
Duration: 06:48

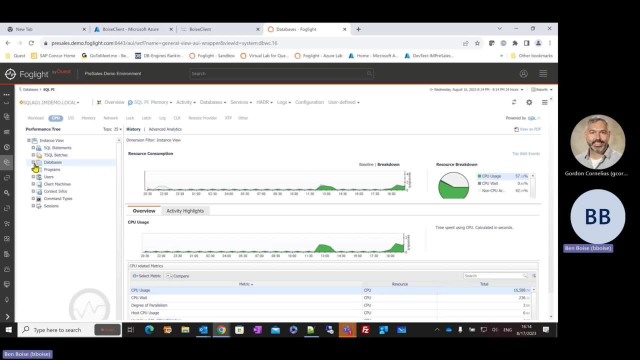
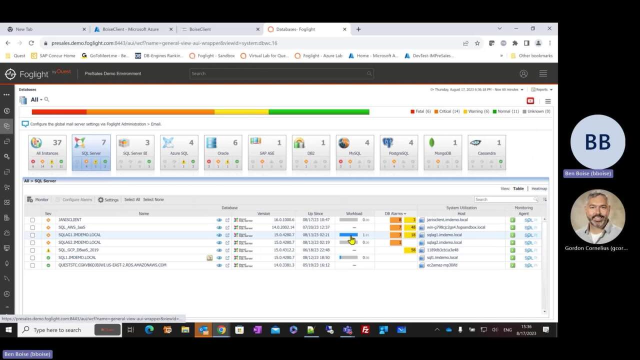
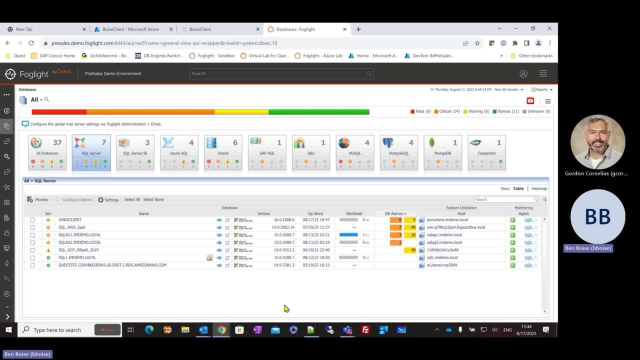
Monitor all your databases from a single, intuitive console
Proactively ensure peak performance across all your databases.
Duration: 29:59
The angular user interface in Foglight 6.1
The angular user interface in Foglight 6.1
Duration: 02:07
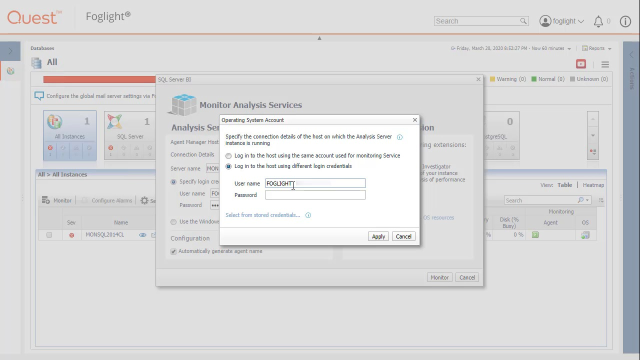
How to Monitor SQL Server Analysis Services (SSAS)
SQL Server Analysis Services (SSAS) is an online analytical processing and data mining tool that many organizations use for business intelligence. You can create a monitoring agent for SSAS within Foglight. Note that a SQL PI Repository server is required. This video demonstrates how to create the monitoring agent.
Duration: 05:42
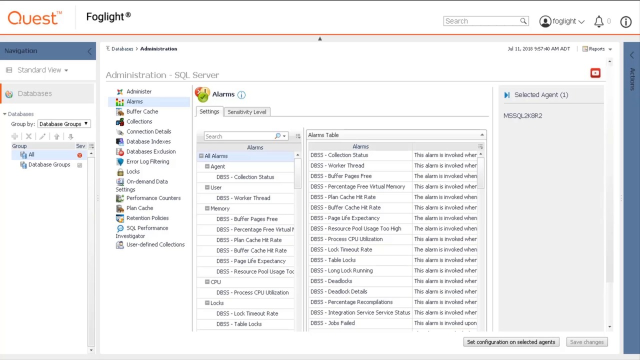
Defining Database Agent Alarm Sensitivity
This quick video shows how to select and modify the sensitivity levels assigned to each agent. The sensitivity level controls which alarms are reported. For each agent, you can choose from Essential, Normal, Tuning or Performance for the sensitivity level. Normal is the default.
Duration: 02:40
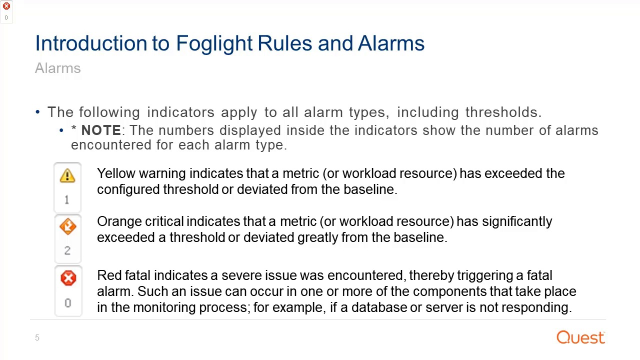
Introduction to Rules and Alarms
Foglight tracks system metrics and constantly evaluates those metrics against rules. If conditions are matched, an alarm is fired. This video gives an overview of the three types of rules and how alarms are displayed according to severity level. It also discusses how alarms are acknowledged and cleared by system operators.
Duration: 04:48