Hi. My name is Amit Parikh and I'm the subject matter expert for Cassandra here at Quest Software. In this short video, I will focus on how Foglight can be used to tackle common performance challenges faced when monitoring Cassandra. While Cassandra has some similarities to traditional relational databases, the way that availability, performance, and capacity are managed is quite unique.
Cassandra's distributed architecture, with a multitude of nodes containing data with various replication factors and consistency levels, only adds to the complexity of ensuring a highly available and well performing environment. Companies that do not have an efficient way of managing Cassandra often struggle to realize the benefits that the platform can provide them. What if you can rapidly detect, diagnose, and resolve performance issues across your physical, virtual, and cloud-based Cassandra database servers. Let's take a closer look at a few important use cases where Foglight can provide value in monitoring performance in Cassandra.
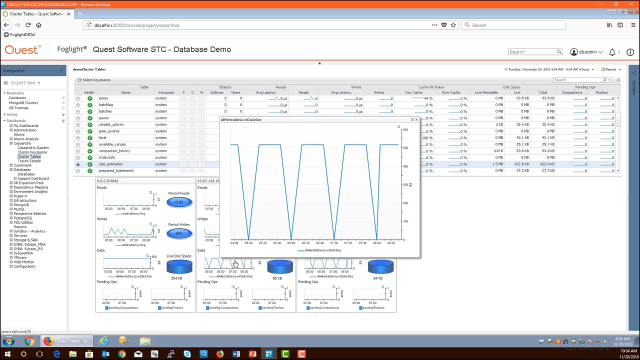
Use Case 1, monitoring latency for reads and writes in Cassandra. I'm going to go into my lab here where I have a number of different database platforms being monitored by Foglight. Specifically, I have a tile for Cassandra, which allows me to organize the clusters that I'm actually monitoring with the solution and drill into them. I'm going to click on the cluster of focus and expose the nodes table, which conveniently shows us the reads and writes performance for each of the nodes in the cluster. And if I wanted to trend this historically over a period of time, I have the capability of doing so up here on the top right, where I'm focusing on the last four hours of performance.
You can see here, also, that if I click into any of these metrics, this exposes a pop up graph, which allows us to specifically see the trends of read and write latency over that specified period of time. To further this research into latency, I might want to expose the coordinator latency, which is the time it takes for a coordinator to process an incoming request, send that request to all the nodes, and get the requisite number of responses from however many number of nodes set forth by the consistency level used.
One of the ways we can do this is by clicking on the traces button over here on the top right. Now, what the traces button allows us to do is organize traces per coordinator, which are essentially the nodes in the cluster. I could set the trace probability based on the set trace probability parameter in Cassandra. There are varying levels that you could explore, each of which allows you to catch a specific percentage of transactions or requests that are handled at each of the nodes. Here you can see a sampling of traces that took place by specific coordinators in this cluster. What I'll be able to do is focus on transactions that had a higher than normal duration, for example, the second transaction here in this list-- can drill down into it.
You'll see that this transaction happened on a couple of different occasions, each using a different consistency level. And you can see that the difference in duration based on the consistency level used. What I'll then be able to do is click on the load events button, which then allows me to explore the events that took place within the statement-- such as scans, the use of SS tables, et cetera-- and determine the specific timings associated with them.
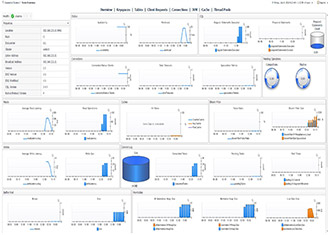
What I might also want to do is explore the latency locally for each key space and table within the cluster itself. Foglight makes this convenient through two specific dashboards. We have a cluster of key spaces dashboard, which allows us to see the same read and write latencies specific to tables and key spaces. But, in this particular dashboard, you'll see that we have boxes for each of the nodes in the cluster. So what we're allowing ourselves to do is expose, locally, the read and write performance for each of the key spaces and tables in the cluster. So you see how I'm doing this here for a specific key space within this cluster. I can go over here to the cluster tables dashboard and essentially do the same thing. Here is the right performance, or the right latency, locally, for a specific node, for this particular table.
And, lastly, if you do have a latency spike, it's important to show the volume of data processed during that latency spike. And you'll see how we showed the data graphs conveniently here at each of the nodes. So you can assess this locally as well.
On to Use Case 2, monitoring uneven data distribution in Cassandra. Cassandra's architecture accounts for high availability and fault tolerance through varying replication factors and consistency levels. This can be configured for key spaces and transactions, respectively, and can be optimized to ensure that the shape of the data across the cluster meets the needs of the data stream. However, uneven data distribution can be a pretty common problem and something you should check on.
Here in the nodes table in Foglight, you can check to see if the amount of data or the ownership of data across nodes is roughly equal. You'll also be able to check on the availability of each node, the amount of objects deployed on each node, the amount of disk space consumed by data on each node, and the SS table creation on each node. Now, if you're concerned about unbalanced racks, whether each rack should have the same number of nodes or if they have more data than others, what you'll be able to do is visually show the data center's racks and nodes here using the topology view in Foglight. What this does is it gives an administrator an at a glance view of their Cassandra cluster and see if anything needs to be redesigned based on
 08:37
08:37


